Dynamic graph visualisation
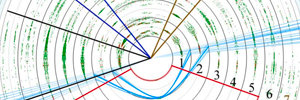
Dynamic graphs encode the change of relations between objects over time, and, as that, are a very flexible and general data encoding. Visualising these graphs in particular for larger data sets and when additional information is available such as a hierarchical organisation of the objects is a challenging task.
Software visualisation

Software visualization refers to visualizing the structure, evolution, or the execution behavior of software systems. Software forms large and complex systems difficult to undertstand, analyze, or manage without tool support. Our work mainly concentrates on visually enriching the source code a developer sees in an text editor with helpful information and revealing the structure of software projects through visualizing code couplings.
Parallel coordinates
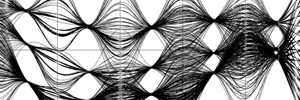
Parallel Coordinates is a visualization technique for multidimensional geometries with many applications for visual data analysis. A parallel coordinate system is constructed by embedding a set of parallel axes into a Cartesian coordinate system.