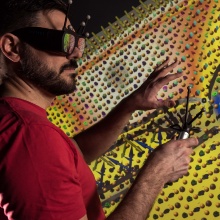
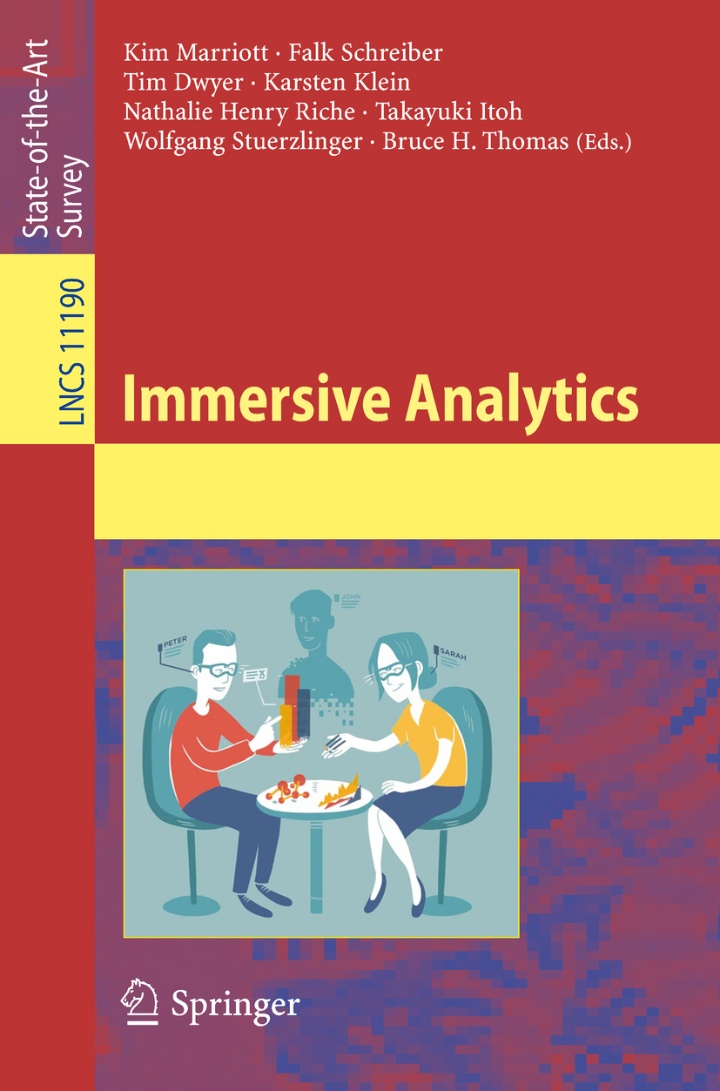
The new computer science book Immersive Analytics by Kim Marriott, Falk Schreiber, Tim Dwyer, Karsten Klein, Nathalie Henry Riche, Takayuki Itoh, Wolfgang Stuerzlinger and Bruce H. Thomas, published by Springer-Verlag, a publishing company for science books, e-books, journals etc., is available online as eBook since 12th December 2018. “Immersive Analytics" means the idea of using VR or AR hardware for visualization and data analysis to support data understanding. What are the chances and problems in the previous use of VR and AR technologies in visualization research and data analysis? Which interaction and visualization technologies exist and which criteria have to be considered in future research? The work provides an overview of existing methods of immersive analytics and future research impulses.
Two VISUS members – Guido Reina and Marcel Hlawatsch – have jointly written with researchers from other universities two chapters (2 and 9) of "Immersive Analytics". In chapter 2 "Immersive Analytics: Time to Reconsider the Value of 3D for Information Visualisation" (p.25-55) they examine the widespread view that 3D representations are not very suitable for information visualization. Is it less intuitive to capture and understand visually processed data and information in an artificial 3D world using Mixed Reality? In which areas do we already use virtual reality and augmented reality tools? How can we better use their potential? In which situation is it more suitable to use 2D, when 3D? Chapter 2 illuminates this topic, and evaluates and reconsiders existing methods.
In chapter 9 "Just 5 Questions: Toward a Design Framework for Immersive Analytics" (pp. 259-288), the researchers develop a classification scheme for existing immersive analytics technologies and methods in visualization and extend existing classification schemes by two further ones that have been neglected so far:
Existing aspects:
- What to visualize? (Which data to use?)
- Why visualizing? (Which tasks are the basis for the visualization?)
- How to visualize? (Which methods to use?)
New aspects:
- Where to visualize? (What is the user's environment like?)
Example: “Controlled environment”? Office? On one’s way? - Who uses the visualizations? (Individuals or groups?)
Example: Existing physical or tele cooperations?
The classification scheme makes it possible to classify and compare VR and AR technologies and to identify which aspects have not yet been sufficiently researched or even neglected.


