Volume Visualization
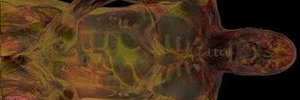
Generation of interactive imagery from scalar three-dimensional data, for instance using data from medical imaging or complex simulations.
Molecular Dynamics Visualization
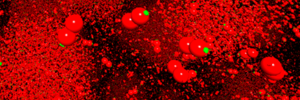
The results of particle-based simulations are difficult to analyse. Specifically, unexpected effects are not easy to grasp. Interactive visualisation helps in the process of analysing the results of such simulations.
Flow, Vector Field and Tensor Field Visualization
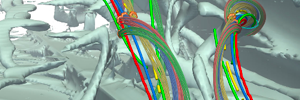
Vectors and tensors are being used if directional information are important, for instance when investigating data from magnetic resonance imaging.
Visualization of Protein Dynamics and Systems Biology

Simulations are a key enabler for new insights in systems biology research. New visualisation techniques help understanding the outcomes of such simulations.
Visualization of Astronomical Data and Objects

We develop novel and fast interactive visualisation techniques for the faithful reconstruction of actual astronomic objects. This way, three-dimensional visualisations can be constructed from two-dimensional imagery.
Texture-based Flow Visualization
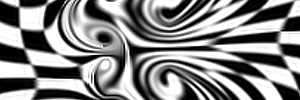
Vector fields are often visualized by means of glyphs. Texture-based methods create, in contrast, a dense representation by assigning directional information to each pixel.
Visualization in Special and General Relativity

Effects of the theory of relativity are difficult to understand for the layman. Computer simulations with accompanying visualisation can provide intuitive access to those phenomena.