Volume vizualisation deals with creating a visual representation of scalar data in three-dimensional space. Typical examples come from medical imaging techniques like computed tomography (CT) or magnetic resonance imaging (MRI). Other application areas for volume visualisation are the exploration of complex simulation data in areas like fluid dynamics, geology or seismology. In order to obtain the visualisation, the underlying data are samples, shaded using a physical lighting model and projected onto the image plane. The user usually can interactively adjust colour and opacity values for the data using a transfer function to hide or highlight certain regions in the data.
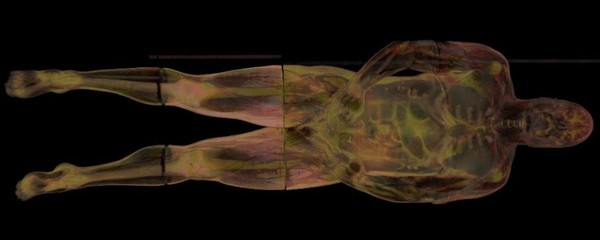
 Parallel visualisation of the "Visible Human" data set on 32 cluster nodes (Data source: U.S. National Library of Medicine).
Visualization Techniques
The display of three-dimensional volumetric data requires a projection onto the image plane. Different techniques can be used to achieve different effects highlighting different aspects of the data. Typically, an emission and absorption model is used, which assumes each data point to emit a specific colour while absorbing the light of other data points along the view ray. The "maximum intensity projection" is a technique which yields the data point with the maximum emission along each view ray. An important application area for that is medical imaging. More complex techniques allow for interactively controlling the emission and absorption values by means of so-called transfer functions, which allo classifying certain value ranges with a certain colour. Iso-surfaces are the areas defined by a certain scalar value. They can be used to show areas with different properties in the data. More recent techniques "interval volumes" try to generalise these techniques to form a holitistic model.
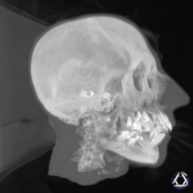
 Visualisation of a CT scan using a maximum intensity projection. Visualisation of a CT scan using a maximum intensity projection. |
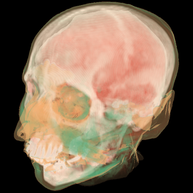
 Visualisation using a combination of direct volume rendering and iso-surfaces. Visualisation using a combination of direct volume rendering and iso-surfaces. |
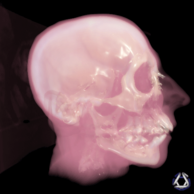
 Visualisation using direct interval volume visualisation. Visualisation using direct interval volume visualisation. |
Modern imaging technology and simulations yield larger and larger data set, which in turn pose a challenge to visualisation methods. In order to handle such large data, parallel algorithms leveraging the computational power of GPU clusters have become an important tool. When parallelising volume visualisation, the computation is split into mostly independent parts which can be assigned to different GPUs on different computers. Such subdivisions can occur in image space, i.e. different parts of the image are computed on different machines, or in object space, i.e. the data set is split into smaller bricks which are processed on different machines. While the first technique achieves good scalability with the size of the output image, it does not allow processing larger data sets. This can be done with object-space subdivision, which, however, requires a final compositing step that combines the images of the partial data sets into the final picture.
Parallelisation Techniques
Modern imaging technology and simulations yield larger and larger data set, which in turn pose a challenge to visualisation methods. In order to handle such large data, parallel algorithms leveraging the computational power of GPU clusters have become an important tool. When parallelising volume visualisation, the computation is split into mostly independent parts which can be assigned to different GPUs on different computers. Such subdivisions can occur in image space, i.e. different parts of the image are computed on different machines, or in object space, i.e. the data set is split into smaller bricks which are processed on different machines. While the first technique achieves good scalability with the size of the output image, it does not allow processing larger data sets. This can be done with object-space subdivision, which, however, requires a final compositing step that combines the images of the partial data sets into the final picture.

