Ein Parallel-Koordinatensystem wird konstruiert, indem ein Satz von Achsen parallel in ein kartesisches Koordinatensystem eingebettet wird.Mehrdimensionale Punkte werden durch Linien dargestellt, die die parallelen Achsen an den jeweiligen Koordinaten schneiden. Zeichnet man für jeden Punkt und jedes Achsenpaar eine Gerade, erhält man die gestrichelten Linien in der Abbildung. Im Normalfall wird nur der Teil zwischen benachbarten Achsen tatsächlich gerendert, so dass für jeden mehrdimensionalen Punkt eine Polylinie entsteht (dargestellt durch die dicke schwarze Linie in Abb. 1.).
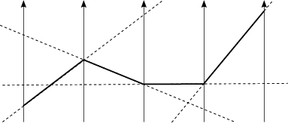
Abb. 1: Konstruieren paralleler Koordinaten
Parallel Coordinates Matrix
Die Reihenfolge der Achsen hat einen großen Einfluss auf das Erscheinungsbild von Mustern bei der Konstruktion eines Parallel-Koordinaten-Plots. Ähnlich wie die Scatterplot-Matrix (SPLOM) visualisiert ein Parallel-Koordinaten-Diagramm eine Reihe von zweidimensionalen Beziehungen zwischen jedem Paar benachbarter Achsen. Ein gängiger Ansatz, um dem Benutzer zu helfen, eine "gute" Reihenfolge der Dimensionen zu bestimmen, besteht darin, paarweise Diagramme zu bewerten, z.B. mit einem Korrelationsmesser.
Die Parallel Coordinates Matrix (PCM) verwendet den gleichen Ansatz wie die Scatterplot-Matrix: Sie zeigt alle paarweisen Beziehungen an. Im Gegensatz zum SPLOM verwendet das PCM kein Matrix-Layout, sondern stellt es effektiv als Liste von Parallel-Koordinatenplots mit unterschiedlichen Achsenordnungen dar. Jedes der einzelnen Diagramme zeigt alle Dimensionen der Daten und alle Diagramme zusammen zeigen alle paarweisen Beziehungen.
Weitere Informationen finden Sie in der untenstehenden Publikation oder im dazugehörigen Video.
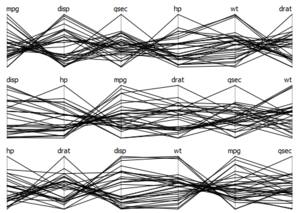
Abb. 2: Parallel Coordinates Matrix mit sechs Dimensionen des Cars-Datensatzes.
Continuous Parallel Coordinates
 |
 |
|
|
 |
 |
|
|
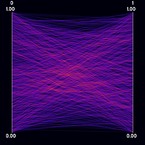
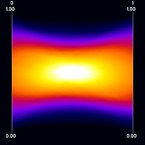
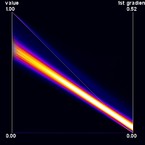
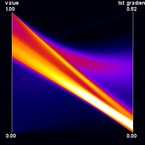
Continuous Parallel Coordinates visualize the density of lines instead of rendering "discrete" lines. This is particularly useful for large datasets where heavy overplotting might occur with the traditional approach. Ed Wegman provided such a line-density model for normally distributed data as early as 1991. In our work, we use a different density model which is applicable to any bivariate density distribution. Continuous Parallel Coordinates basically transform densities from a continuous 2D scatterplot to 2D parallel coordinates (i.e. with 2 axes) exploiting the point-line duality between Cartesian and parallel coordinates. Figure 1 shows an artificial dataset that was created on a 3-D grid with spatial resolution 10 x 10 x 10. For each voxel, two values were randomly drawn from a gaussian distribution. Figure 2 shows the corresponding continuous version. Figures 3 and 4 show a dataset that comprises a CT scan of a tooth with resolution 128 x 128 x 160. In addition to the value contained in the dataset, the gradient was computed at each voxel position. In this example, the sampling artifacts may lead to misinterpretation in the discrete parallel coordinates plot. First, there seems to exist a dense (white) region on the first dimension, which is not existent in continuous parallel coordinates. Second, a large number of values equal to one in the first dimension with a zero-length gradient are mapped to the same line, resulting in a visually striking peak in the density distribution. Again, this peak does not occur in continuous parallel coordinates. Finally, samples at "empty" regions which may be classified as background noise are naturally removed by continuous parallel coordinates.
Bundled Parallel Coordinates
 |
 |
|
|
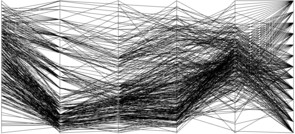
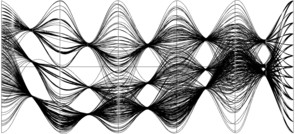
A common way to visualize categorical data in parallel coordinates is to color each line by the class or category it belongs to. In many cases, such classes represent clusters of "similar" datapoints. Another technique that relies on geometry only is to employ bundling. Here, data samples are rendered as curves instead of lines. Then, all curves belonging to the same class or cluster are "bundled" together midway between adjacent axes. Bundles are easier to visually trace over all dimensions while retaining the original coordinates at the axes. The color channel is now free to be used for other mappings.

